Executive Director's Blog Archive
June 25, 2015
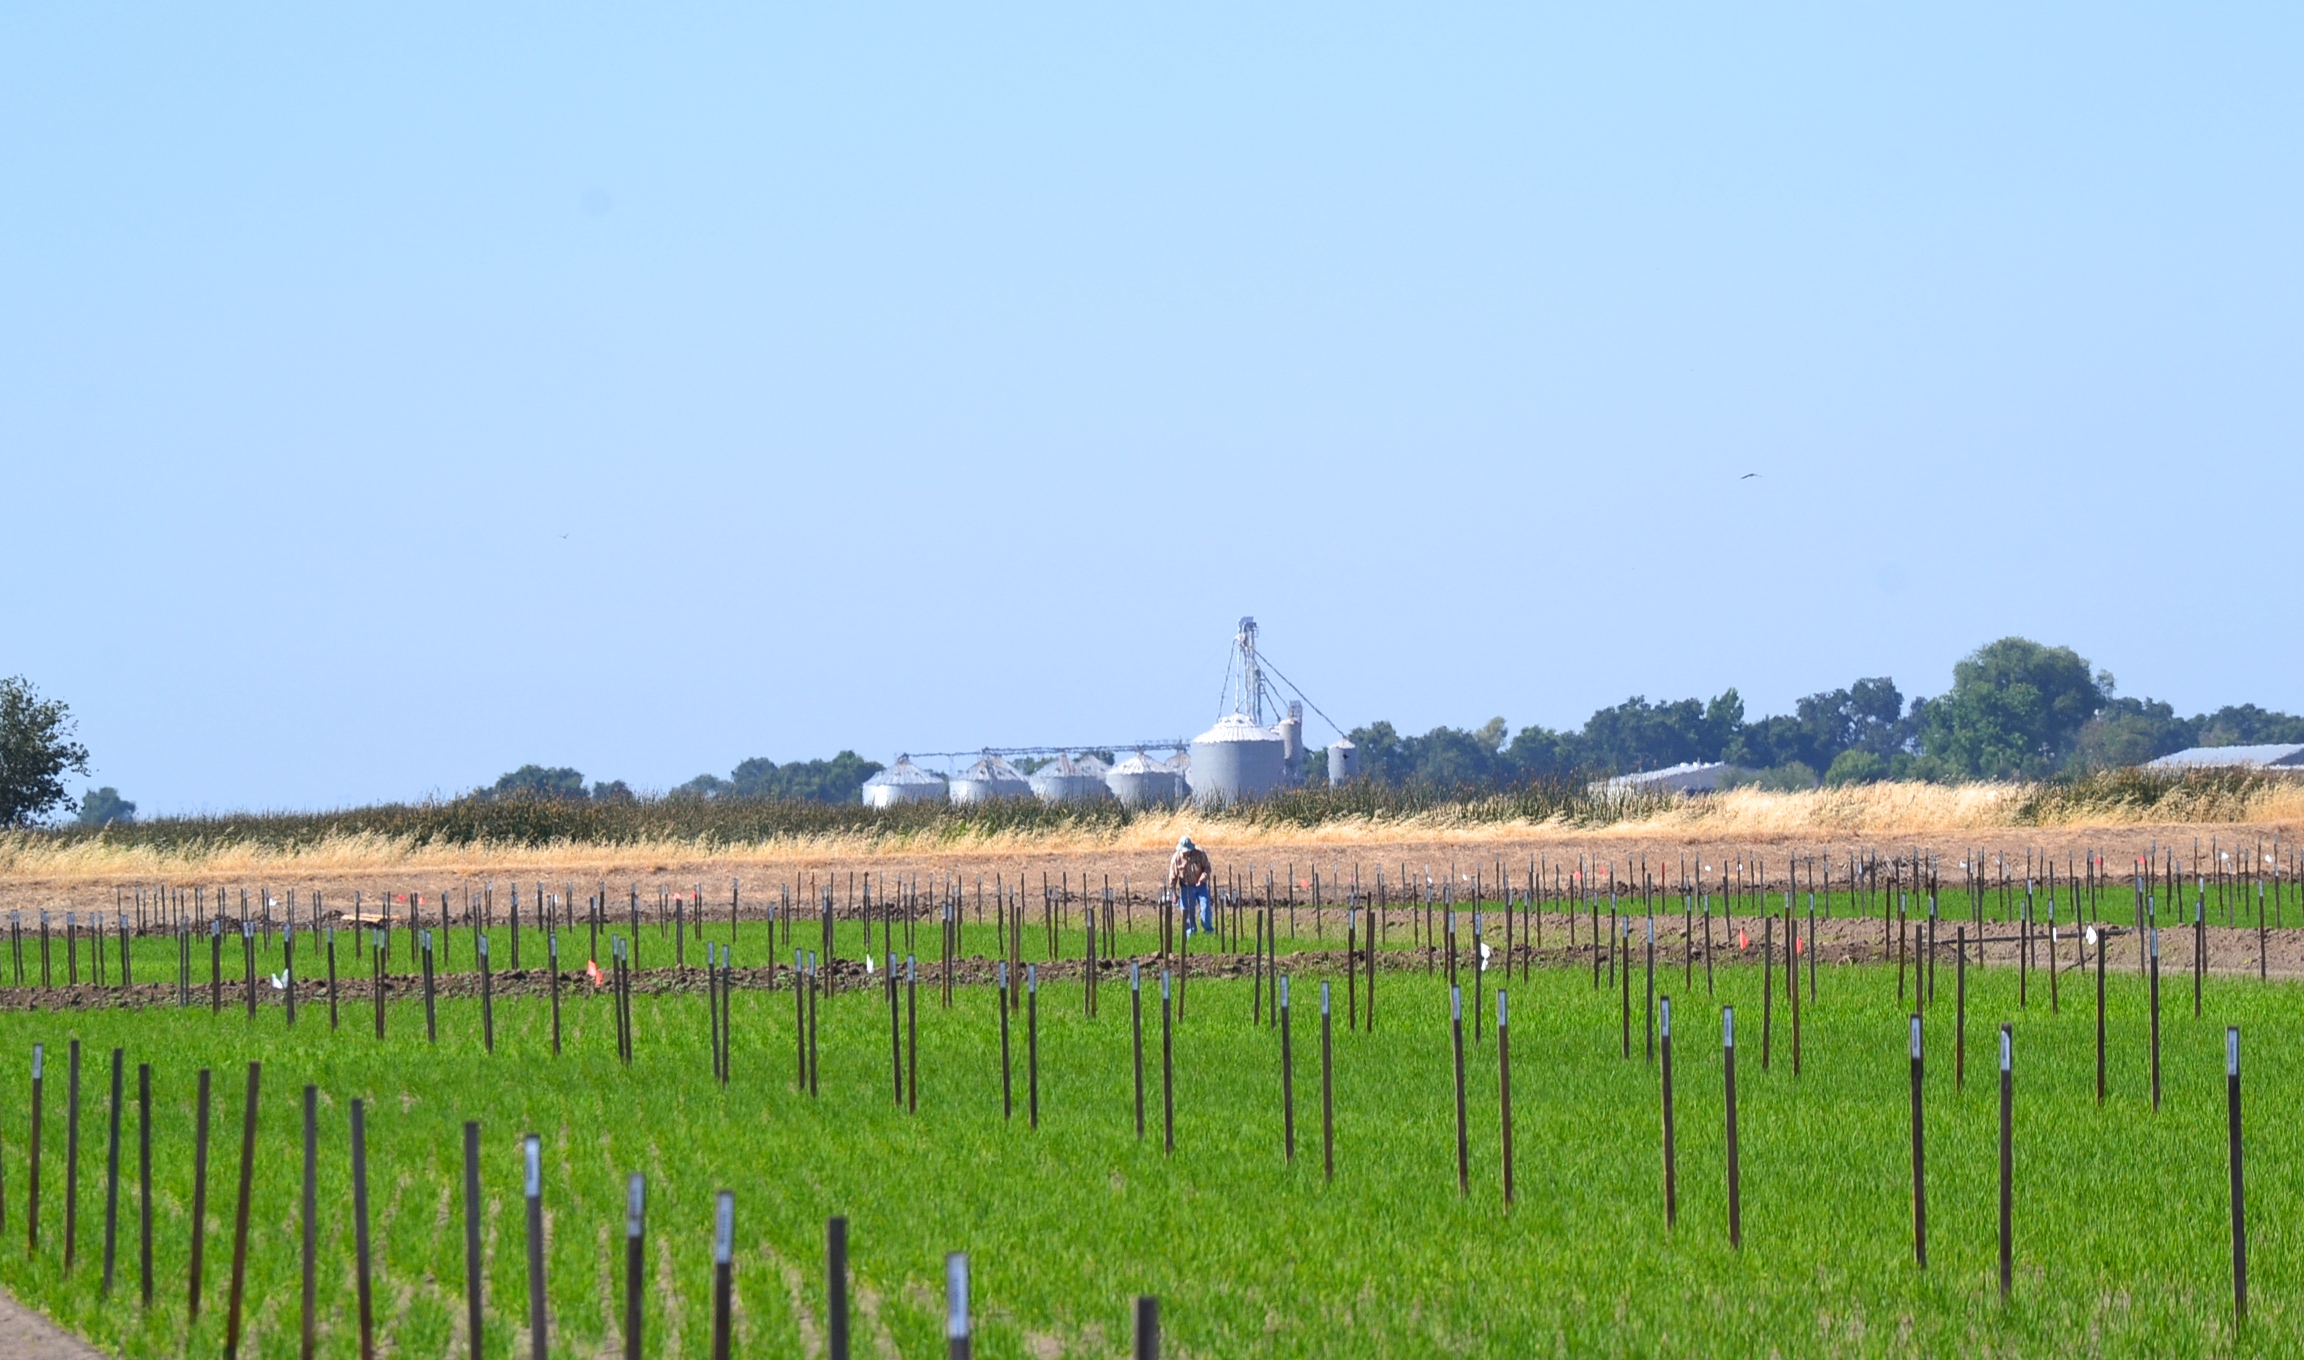
Rice experiment
The Conservancy is required to cooperate with scientists in exploring new and better ways to…
June 16, 2015
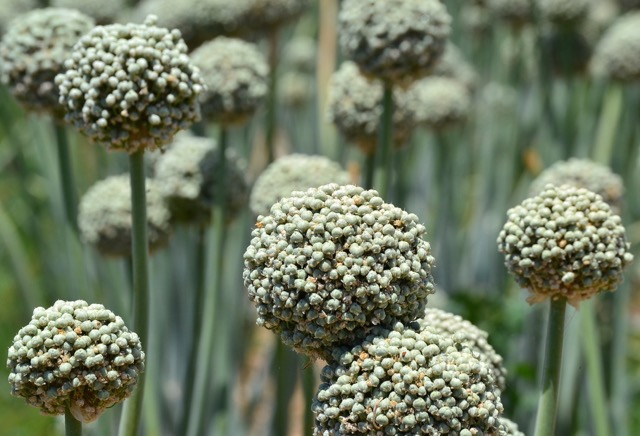
It smells like onions
The photo here shows onions that have matured on Conservancy property. Normally onions don’t provide…
May 6, 2015
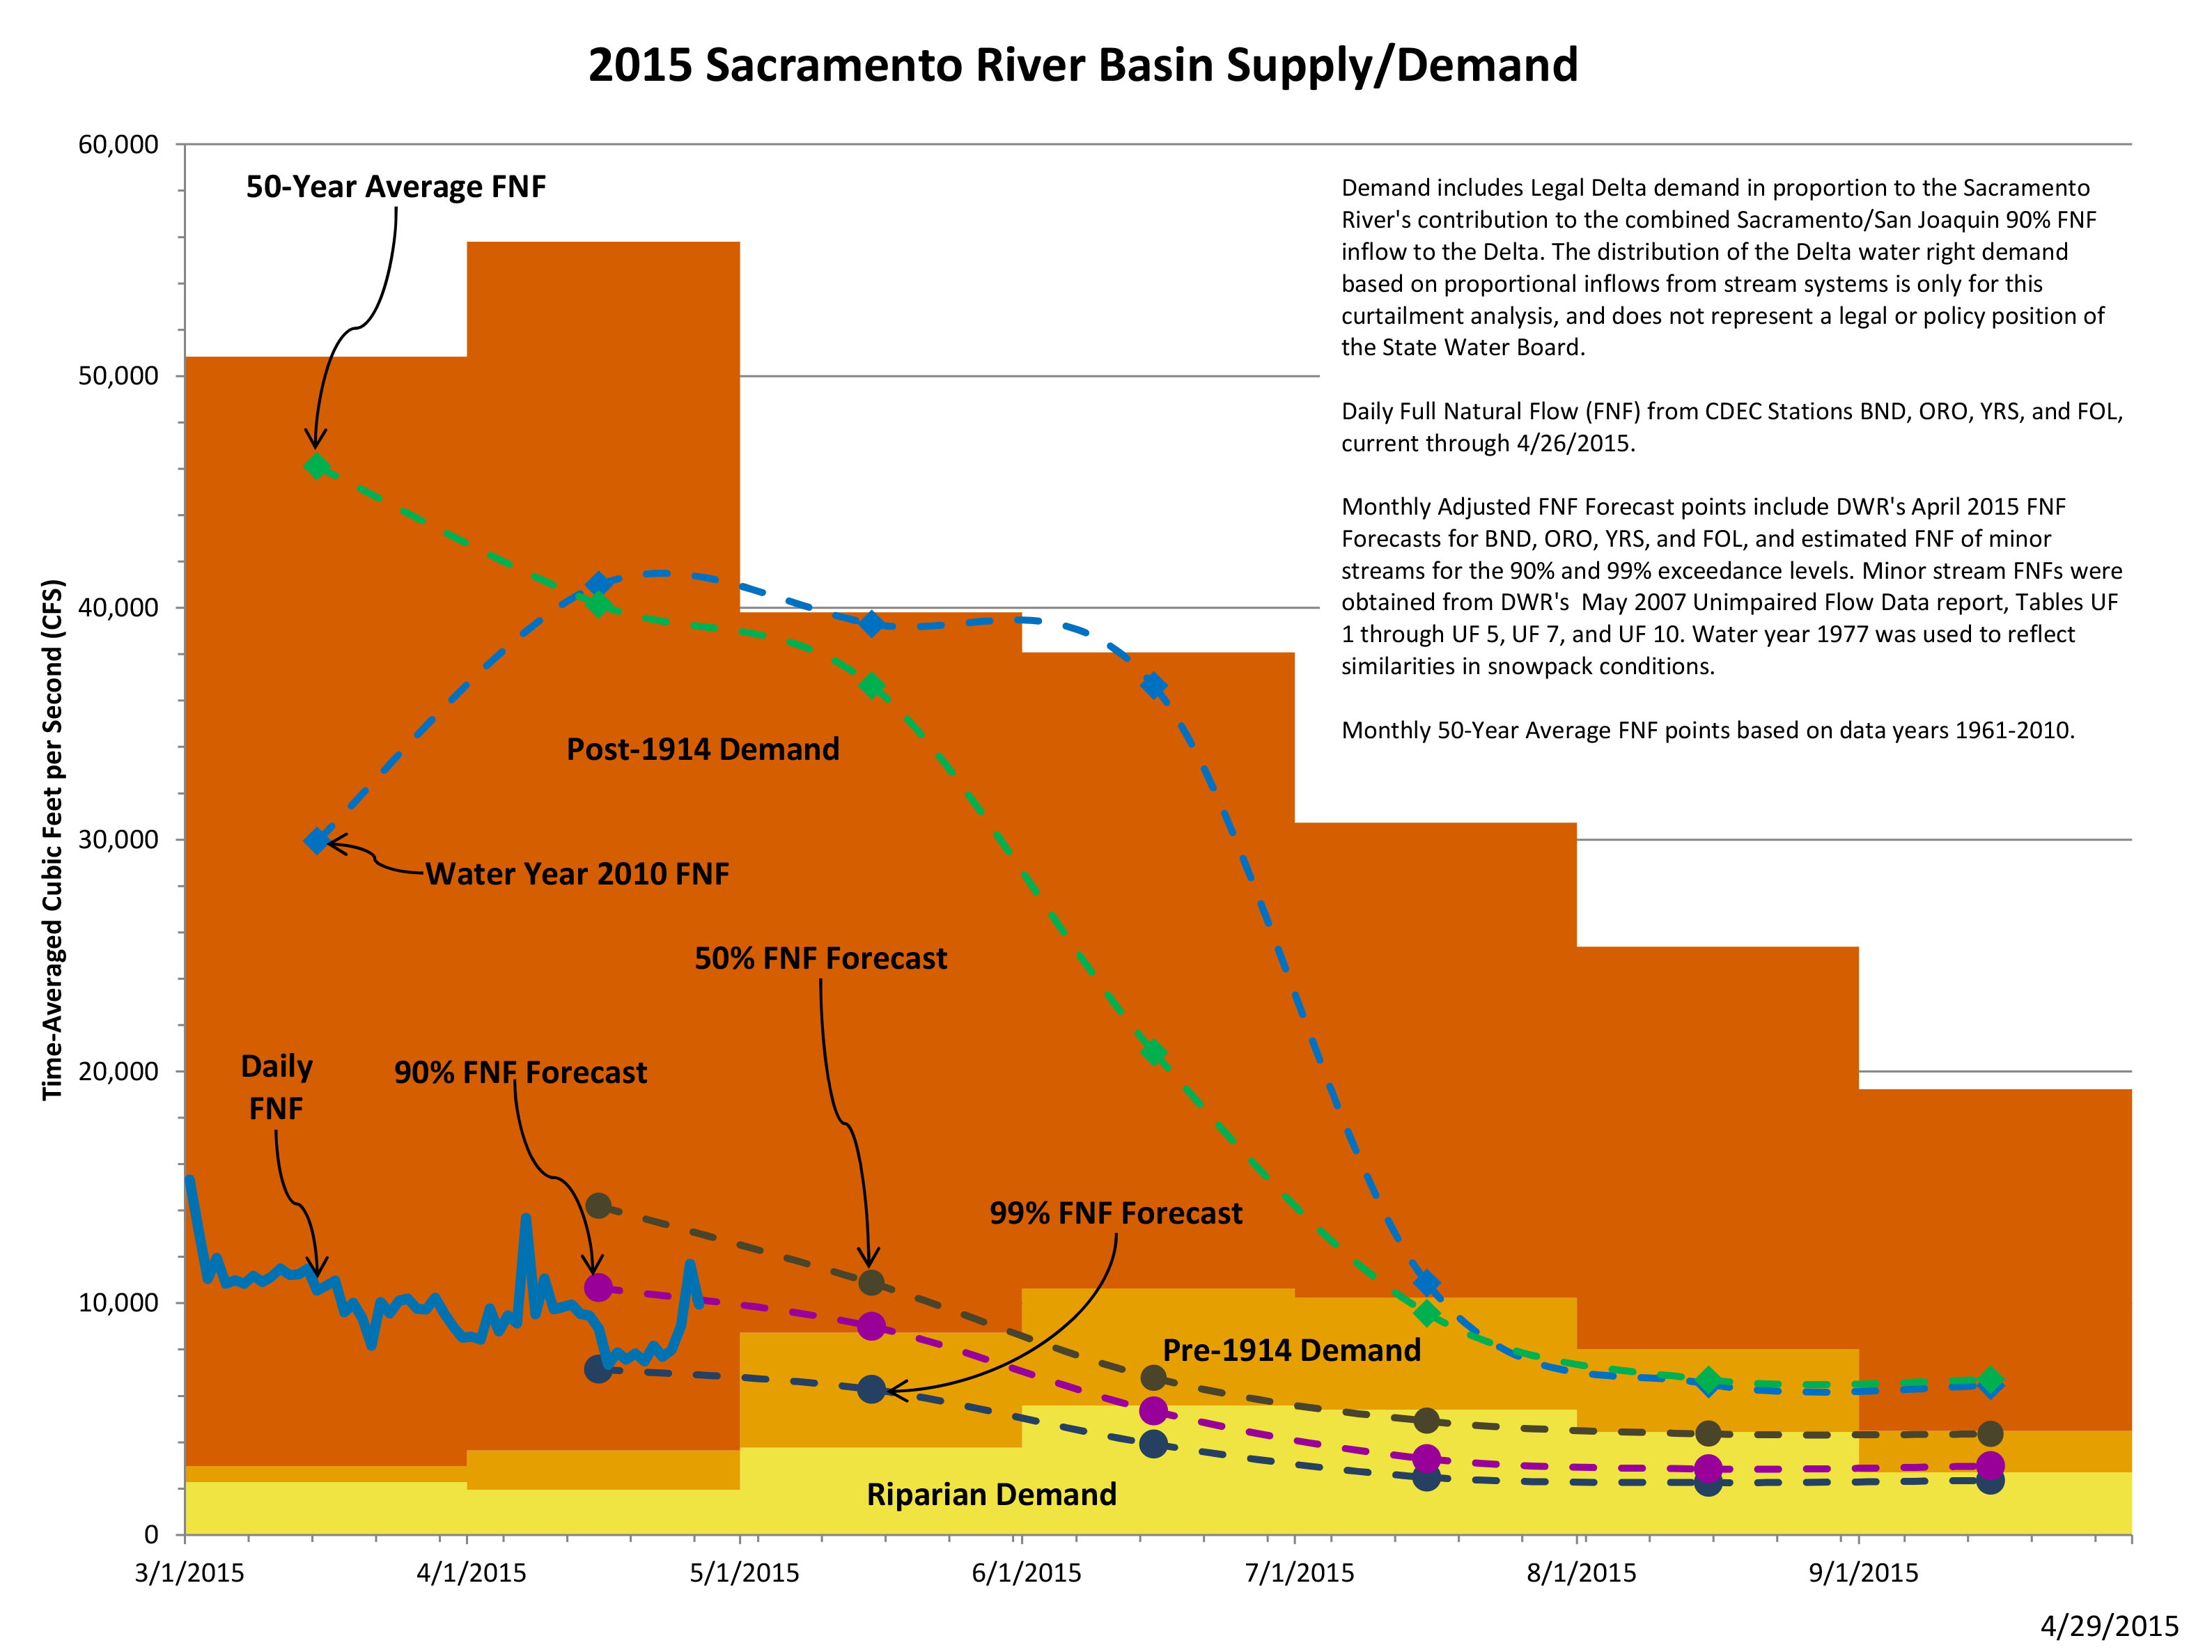
Drought portends
The State of California’s State Water Resources Control Board (“State Water Board”) recently released the…
March 31, 2015
Well Works
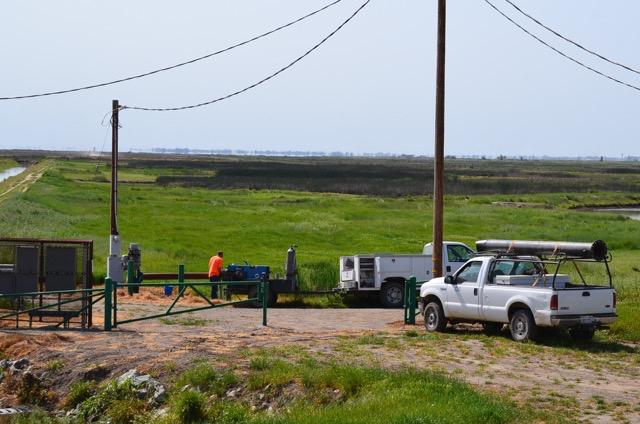
This extended drought creates so much anxiety. Will we get enough surface water to flood…
March 31, 2015
In times of drought…
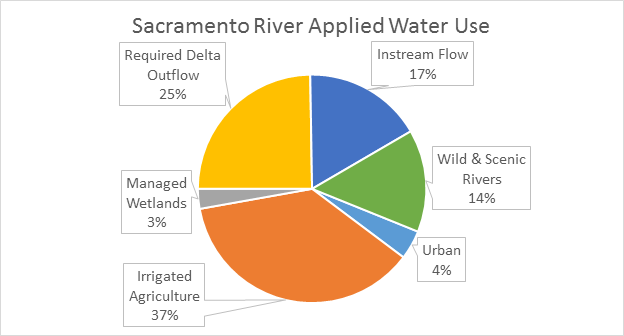
In times of drought, it is important to keep in mind where the region’s water…
October 23, 2014
If there is one, this is it.
Regulars know that one the most challenging problems the Conservancy deals with each day is…
September 25, 2014
Quien es mas macho?
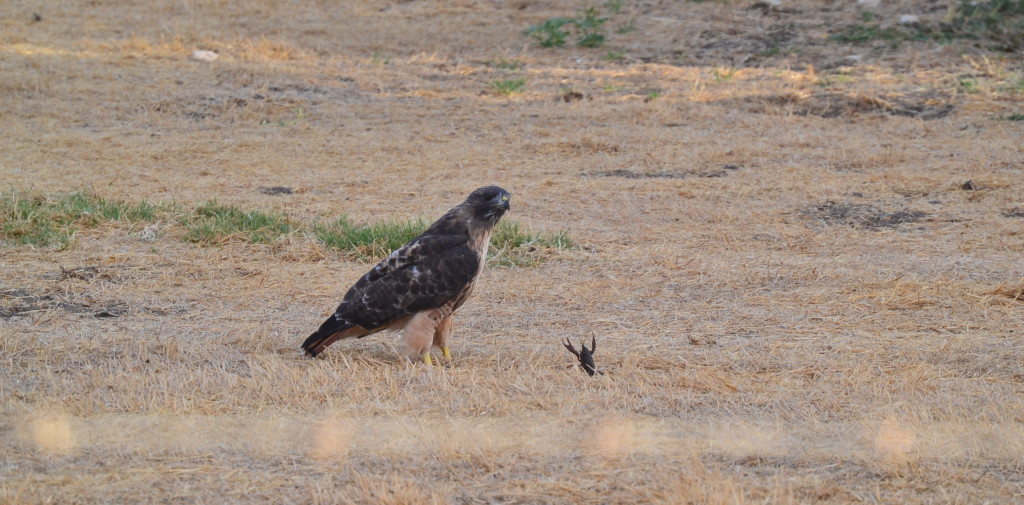
This famous Billy Crystal line from Saturday Night Live could be used for this standoff….
August 27, 2014
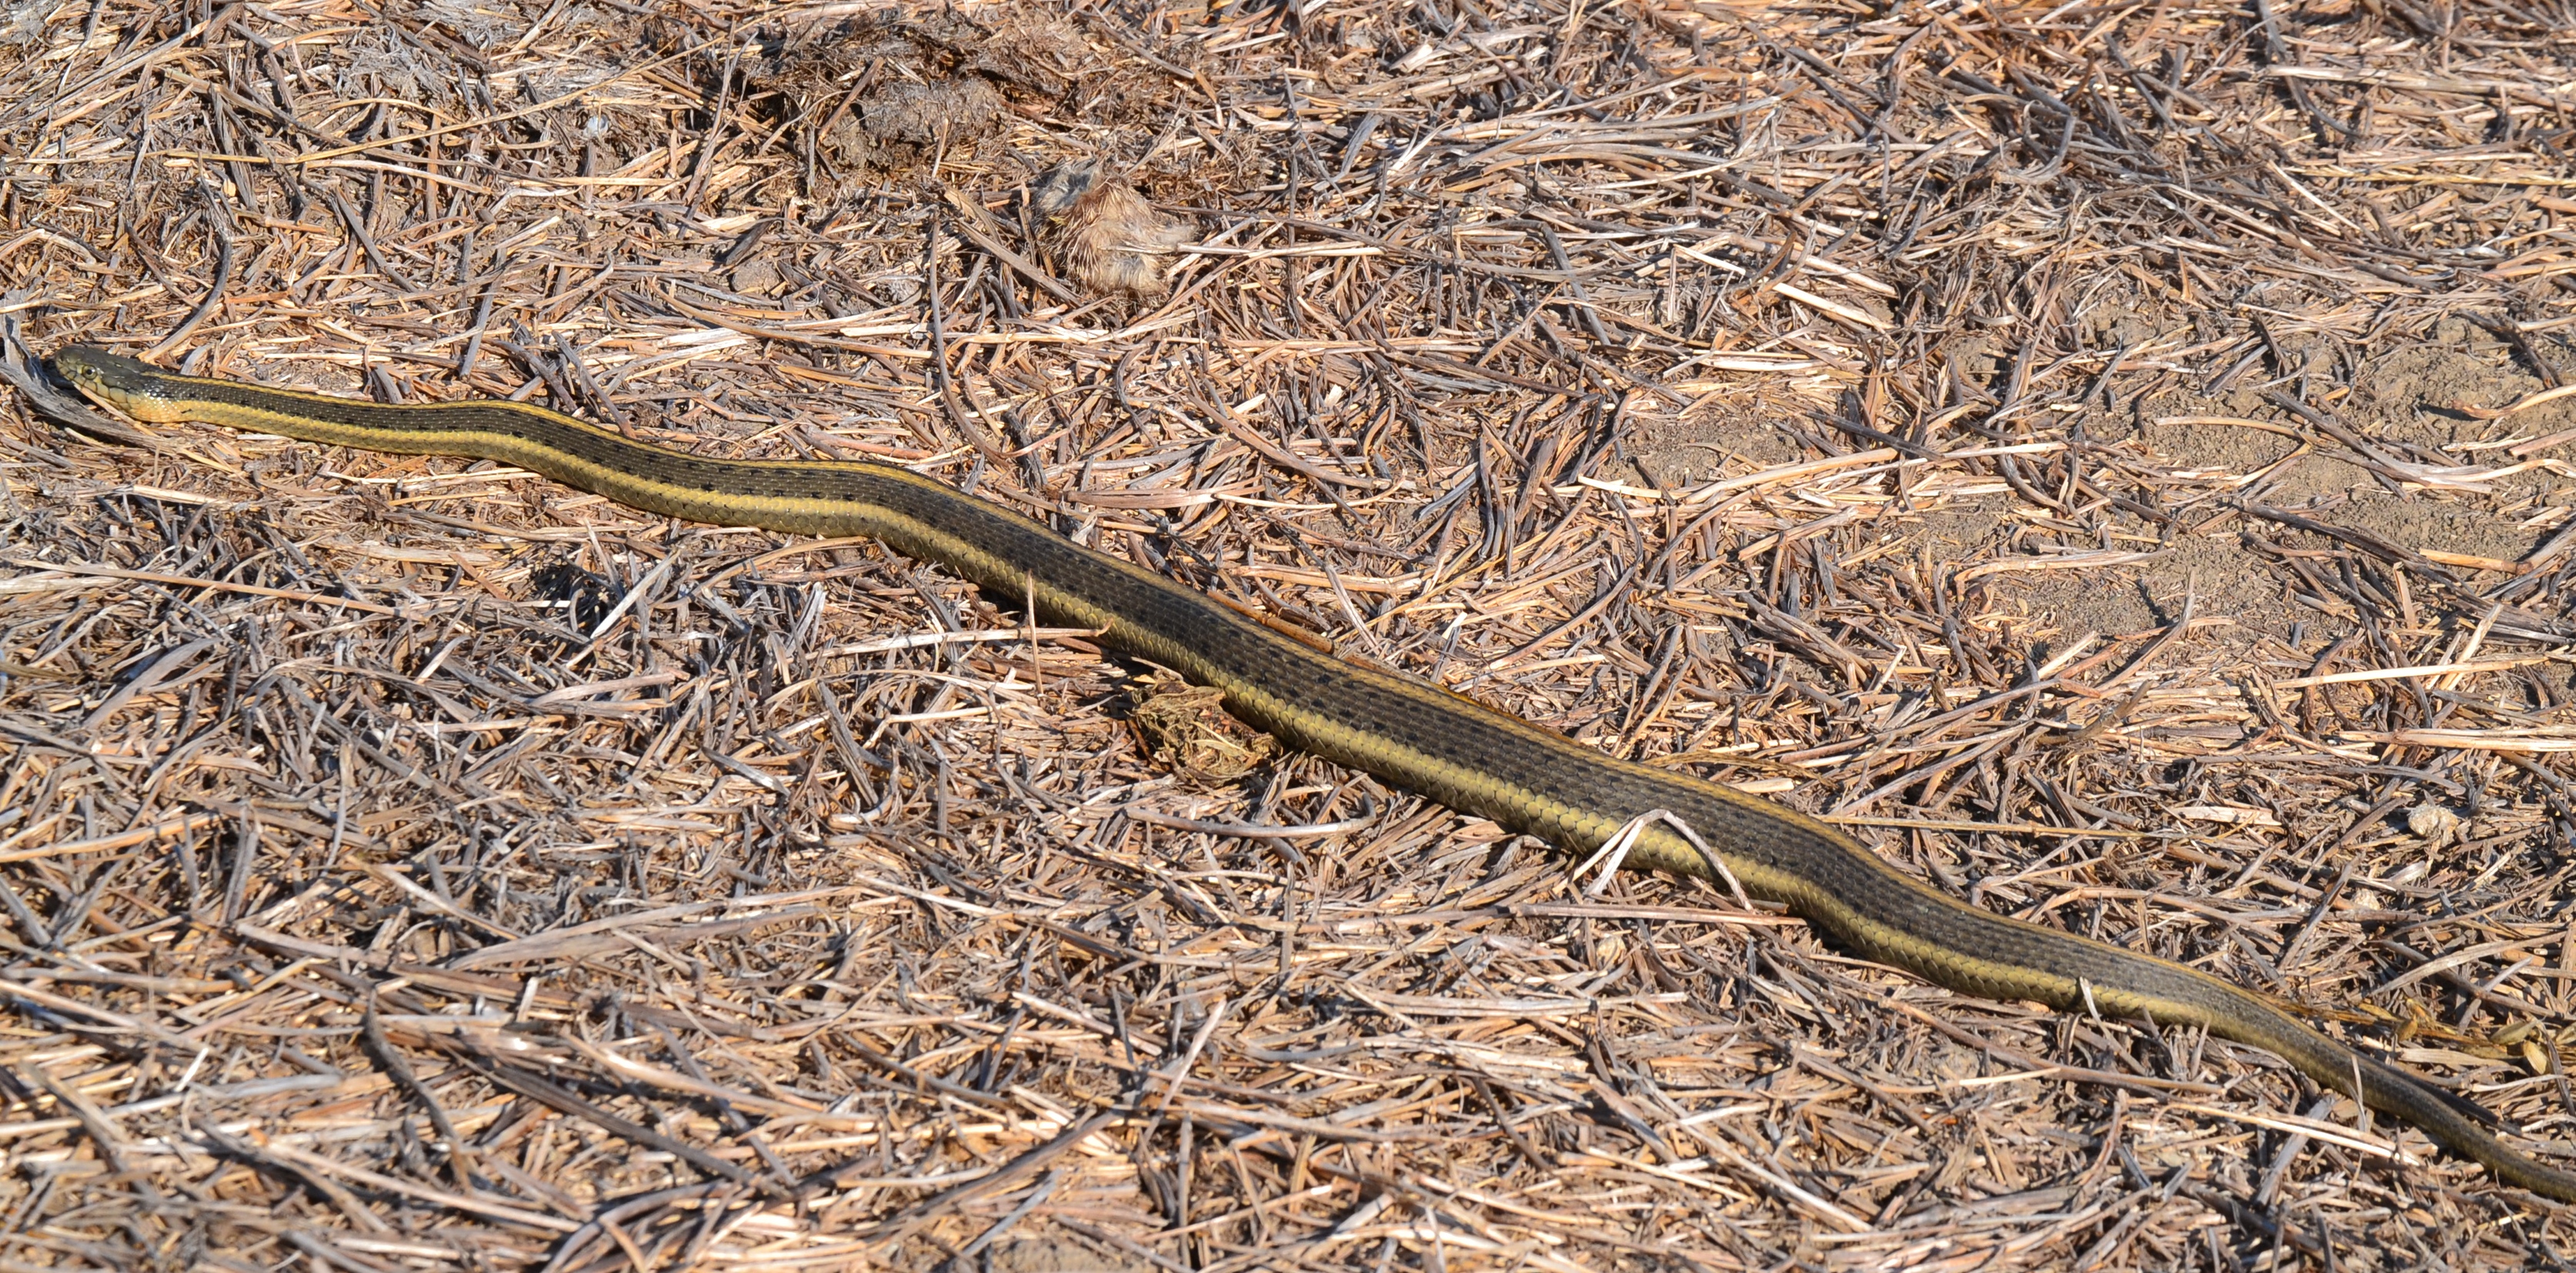
Another beauty-aquatic snake department
This female Giant Garter Snake is about to give birth, judging by the looks of…
