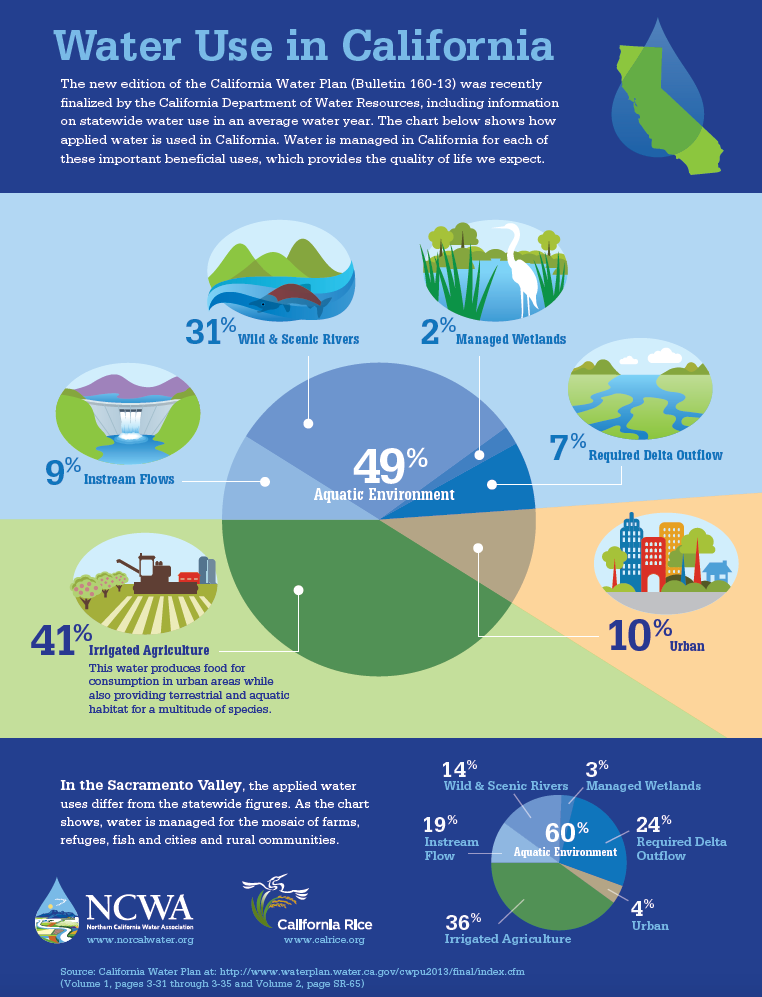
In a previous posting, I shared a water use graphic that helped explain where water flows in California. There is so much information in the popular media about the uses of California’s water resources that is inaccurate; I went looking for clarity from an authoritative source. It’s always best when we look for solutions to problems by working from a data set that is authoritative and accurate.
This is especially important in these times of severe drought. There is a better graphic than the one I presented before, and with updated numbers. This graphic comes from the California Water Plan (Bulletin 160-13) produced by the California Department of Water Resources. This graphic is clear and concise and, we think, promotes understanding as to the uses of California’s water supplies.


